Think like a scientist: Sieve testing

In this series we take a look at how we can apply the scientific method to our home brewing practice, helping you learn to think like a scientist.
Here we will investigate granulometry, commonly known as "sieve testing", which is a way to objectively measure how well the grain was crushed during the milling process. What is sieve testing? In a nutshell, a sample of milled grain is passed through a series of sieves, separating it into fractions based on the particle size. For example, large particles such as husk material will remain on the top sieve and small particles like flour will make their way down to the bottom pan. Now let’s work our way through the steps of the scientific method.
Ask a question
Our goal here is to operate with as few assumptions as possible, so we start with the basics: Can sieve testing help improve our milling technique?
Background research

The necessary background research has been thoroughly discussed on the Brewing Forward wiki (see Milling). Most notably, one of the most important aspects of milling is the husk integrity—how much the barley husks are damaged by the mill. The husk integrity generally affects the ability to lauter and recirculate during the mash, and can also affect beer quality. A second important parameter is how well the starch is crushed, which is important because it relates to efficiency, gelatinization, saccharification time, and attenuation. Important milling parameters that affect the crush include mill gap, grain conditioning, and possibly milling speed. Grain conditioning the process of adding a little extra moisture to the barley husk before milling, which improves the husk integrity.
With regard to sieve testing, it is rarely utilized by home brewers, but there are some professional guidelines and a few articles published online. Testing protocols are in place by the American Society of Brewing Chemists (ASBC) and also MEBAK (a similar European organization) who validate and standardize brewing analytical methods. Large breweries tend to use machines to automatically shake the sieves, but they are expensive and therefore not really an option for small-scale breweries. The ASBC has a protocol for sieve testing by hand. Goal ranges for sieve test results have been suggested by Briess Malt & Ingredients Company (a maltster) and by Dave Miller, author of Brew Like A Pro. These are also reviewed on the Brewing Forward wiki; see Sieve testing.
The hypothesis
A hypothesis is a prediction that can be tested. My hypothesis in this case is the following: We can use sieve testing to determine the impact of different milling parameters on the crush (such as mill gap). This information will ultimately help determine how to adjust the milling parameters to obtain the ideal crush for my system, and also provide more general information that will be useful to help guide others.
A secondary objective is to verify Dave Miller’s hypothesis that we can obtain an "ideal" crush (within his suggested granulometry results) by following a simple method of milling at the maximum gap that still crushes all the kernels. This would be very useful since visually analyzing the crush is much easier than conducting a series of sieve tests and would require no extra expense.
The experiment (methods)

I planned to test different combinations of mill gap, milling speed, and grain conditioning. This will lead to a total of 8 sieve tests. The way a scientist approaches experimentation is to control as many variables as possible so that only the experimental variable(s) will affect the results. In this case, the experimental variables are the milling parameters, and so ideally we want everything else to be exactly the same between different test samples. A secondary goal is to disclose as much information as possible regarding the testing conditions so that knowledgeable readers can decide whether the conclusions are valid (internal validity) and also the reader can determine whether he can use the results to improve his own process (external validity).
The mill used for this experiment was a Kegco 3-roller mill, which was thoroughly cleaned beforehand. The Kegco has 1.5" diameter hardened steel rollers with diamond knurling typical of home brew mills. The fixed gap is 0.060".
For the adjustable gap, 0.046" was chosen as the wide gap for the experiment since it is the largest gap possible on the Kegco 3-roller mill (contrary to advertising). A setting of 0.030″ was used as the narrow gap, which coincides with the standard credit card setting used by many home brewers. In each case, the gap at both ends of the rollers was adjusted using an angled feeler gauge. All of the wide gap tests were done consecutively in order to avoid the possibility of inconsistent gap settings that could be introduced by changing the gap multiple times.
Non-conditioned grain is just normal grain (that has been stored in a sealed plastic bag). Conditioned grain was lightly and evenly sprayed with water and manually stirred until the husk became pliable, and then the sample was allowed to rest for 10 minutes before milling. Right before milling, the sample weight was checked in order to determine the amount of moisture that was added. After milling, the conditioned grain was dehydrated in an oven at 100-130°F until the weight was stable (indicating the excess moisture was gone).
The mill was driven with a variable speed 0-440 RPM cordless drill. The milling speed is difficult to control and standardize because I do not have a way to accurately determine the RPM. In this experiment, "fast" corresponds to full speed, which conservatively we’ll say was over 300 RPM. "Slow" speed was as slow as I could maintain turning the roller, which we’ll say was under 100 RPM.
The grain used for the tests was Great Western Premium Two Row barley malt, a standard American base malt. A malt analysis was not available, but generally this malt is 2°L color and 11.5% protein. The amount of grain used in all samples was 110.00 g before milling. The sample was milled into a small bucket and then transferred to the sieves.
Sieving was conducted according to the ASBC protocol for manual sieve analysis, which you can view on the Brewing Forward wiki. This is the brewing industry standard for sieve testing by hand. Sieves #14, #30, and #60 were used.
Data analysis (results)
The first order of business was to test Dave Miller’s hypothesis regarding an easier way to set an ideal gap based on visual analysis. I milled one cup of grain at the 0.046" gap at fast speed and carefully sorted through the sample. I only found one uncrushed kernel, which was much smaller than the other kernels. Given that this one kernel was an outlier, I deemed that the sample met his specifications. A more coarse crush is not possible on this mill.
The following samples were to be tested:
- Wide gap, non-conditioned, fast speed
- Wide gap, non-conditioned, slow speed
- Wide gap, conditioned, fast speed
- Wide gap, conditioned, slow speed
- Narrow gap, non-conditioned, fast speed
- Narrow gap, non-conditioned, slow speed
- Narrow gap, conditioned, fast speed
- Narrow gap, conditioned, slow speed
| Sample | #14 (%) | #30 (%) | #60 (%) | Pan (%) |
|---|---|---|---|---|
| 1 | 75 | 13 | 6 | 5 |
| 2 | 72 | 14 | 7 | 6 |
| 3 | 73 | 12 | 6 | 8 |
| 4 | 72 | 12 | 7 | 9 |
| 5 | 58 | 24 | 10 | 9 |
| 6 | 54 | 25 | 10 | 10 |
In each test, the total amount of material in the sieves was within 1% of the original weight of grain milled. Only 6 barley samples were tested because the experiment was cut short; the reasons for this are discussed below.
-
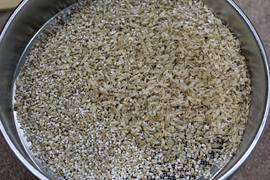
Sieve #14
-
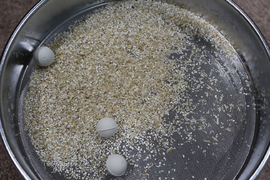
Sieve #30
-
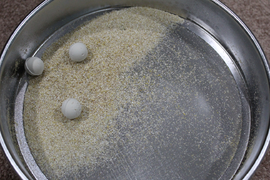
Sieve #60
-
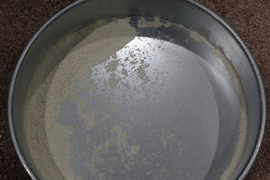
Pan


Sieve contents for non-conditioned grain milled fast at 0.046″.
Conclusions (discussion)
These results reject Dave Miller’s hypothesis that the "ideal" crush can be obtained by milling at a large gap that crushes all of the kernels. Based on the retention by the #14 sieve, all 4 of the samples tested at 0.046" were much more coarse (in terms of granulometry) than the 50-60% he suggests is ideal for sieve #14. His recommended process produces a coarse crush, probably more coarse than most brewers would prefer.
With regard to milling speed, comparison of otherwise identical tests with different mill speeds (1 vs 2, 3 vs 4, 5 vs 6) shows very close granulometry results. There was also no obvious visual difference with regard to husk integrity between the samples milled at different speeds (images not shown). These data show that milling speed does not have a significant impact on the crush under these test conditions. The results are in agreement with a previous study showing no visual difference between samples milled at different speeds on a home-brew-scale 2-roller mill (by Tim Polster on The Modern Brewhouse forum), and also in agreement with results from other published milling studies using granulometry.
Things start to get interesting when comparing the results of conditioned versus non-conditioned grain (1 & 2 vs 3 & 4). The granulometry results are very similar, with perhaps some increase in the pan (i.e. the amount of flour), which increased from an average of 5.9% to 8.6% with conditioning. This is surprising because grain conditioning is very well-known to increase husk integrity, which should substantially increase the fraction on the #14 sieve (assuming the fraction on the #14 sieve is mainly husks). Upon visual inspection, indeed the conditioned samples had much more intact husks (as expected). With this result we can begin to see the analytical method may be flawed since it cannot detect such an obvious difference between the grain samples. There may be a possible explanation for the similar results: something has to give way as the grain passes through the rollers, and since the husk is crushed less when conditioned, the starch may be crushed more, and these differences may offset each other in terms of average particle sizes. However, previous results reported by Dustin Junt on The Modern Brewhouse showed a modest increase on the #14 sieve with conditioning (on a 2-roller mill), although the grain in that case was not correctly dehydrated before sieving and the standard sieve protocol was not followed, and so those results may be questionable (e.g. additional moisture can affect the results).
Decreasing the mill gap to 0.030" had a profound effect on the granulometry results (samples 5 & 6 vs the rest). This is completely expected, as a tighter gap is well-known to cause a more fine crush, increasing damage to husks and producing smaller starch grits. However, thinking like a scientist is about far more than just blindly interpreting the numbers from test results; careful observation and critical thinking must also be applied, especially when combined with the knowledge acquired from doing adequate background research. A visual examination of the #14 sieve reveals a significant finding:

We can see there’s a tremendous amount of starch grits remaining on the #14 sieve—in fact, it looks like the sample is mostly grits in terms of mass. Let’s compare this to the image of the #14 sieve fraction provided by Briess (presumably milled on a commercial mill, and tested using the ASBC protocol):

We can readily see that the #14 sieve fraction from Briess shows a completely different composition. This image appears as predominantly husks with a relatively small amount of starch grits visible. The husks also appear to be more intact. This is despite the fact that the sample in the present experiment was more coarse according to the granulometry results (58% vs 53% on the #14 sieve).
The ASBC description from the sieve fractions is also telling:
| U.S. Sieve | Opening | Grist Fractions | |
|---|---|---|---|
| Microns | Inches | ||
| No. 10 | 2,000 | 0.0787 | Husks held |
| No. 14 | 1,410 | 0.0555 | Husks held |
| No. 18 | 1,000 | 0.0394 | Husks held |
| No. 30 | 594 | 0.0234 | Coarse grits held |
| No. 60 | 250 | 0.0098 | Fine grits held |
| No. 100 | 150 | 0.0059 | Ordinary flour held |
| Pan | ... | ... | Fine flour |
Again, we see that sieve #14 (and even down to sieve #18, which is smaller) should contain predominantly husk material.
What do we conclude from this? It’s clear that this method certainly can sort the milled grain by particle size, but sieve testing completely fails at measuring husk integrity. The composition of the milled grain is far more important for the brewing process than just the average particle size—we want intact (large) husks and thoroughly crushed (small) starch grits. The home brew scale mill used in this experiment produced a vastly different crush composition than the commercial mills, which greatly changed the composition of the sieve fractions (#14 in particular). Therefore, this analytical method is not useful for comparing the resulting crush of home brew mills to the suggestions provided by professional sources. In other words, the information that home brewers can gain from sieve testing has no reference or guidelines for how to use it. Moreover, sieve testing is likely more trouble than it’s worth because an experienced brewer can easily and adequately determine the extent of husk damage using a simple visual inspection (which is the common practice among commercial brewers). The experiment was cut short once this determination was made.
I hope this has helped give some insight into the need for proper background research and the importance of critical thinking and careful observation when using a brewing analytical method. The science doesn’t stop here... Keep on asking questions, testing hypotheses, and reporting results!
Special thanks to the group at The Modern Brewhouse and Benson Ledbetter for loaning me the test sieves, and to Briess for the great presentation.